We analyzed every Bitcoin block ever mined: all 943,543 of them, from the genesis block on January 3, 2009 through block 943,542 on April 3, 2026. The records below are based on the actual share difficulty of each block compared to the network difficulty at the time it was found.
Quick primer: Every block hash has a share difficulty, a measure of how rare that particular hash is. To be valid, a block's share difficulty must meet or exceed the current network difficulty. The ratio (share difficulty ÷ network difficulty) tells you how much the block overshot the requirement. A ratio of 1.0x means it just barely qualified. A ratio of 1,000x means the miner found a hash a thousand times harder than necessary.
The Highest Share Difficulty Ever
On October 4, 2022, BTC.com's mining pool found a block with a share difficulty of 50,541,668T, over 1.6 million times harder than the 31.36T the network required. This block didn't just beat the difficulty; it obliterated it.
The block hash tells the story visually. Count the leading zeros:
That's 24 leading hex zeros, the most of any Bitcoin block ever mined. Only two blocks in all of Bitcoin's history have achieved 24 leading zeros. For context, a typical block today has 19-20 leading zeros.
Share Difficulty Through the Years
As more miners join the network and hardware improves, both the network difficulty and the typical share difficulty of found blocks have increased every single year since Bitcoin's inception.
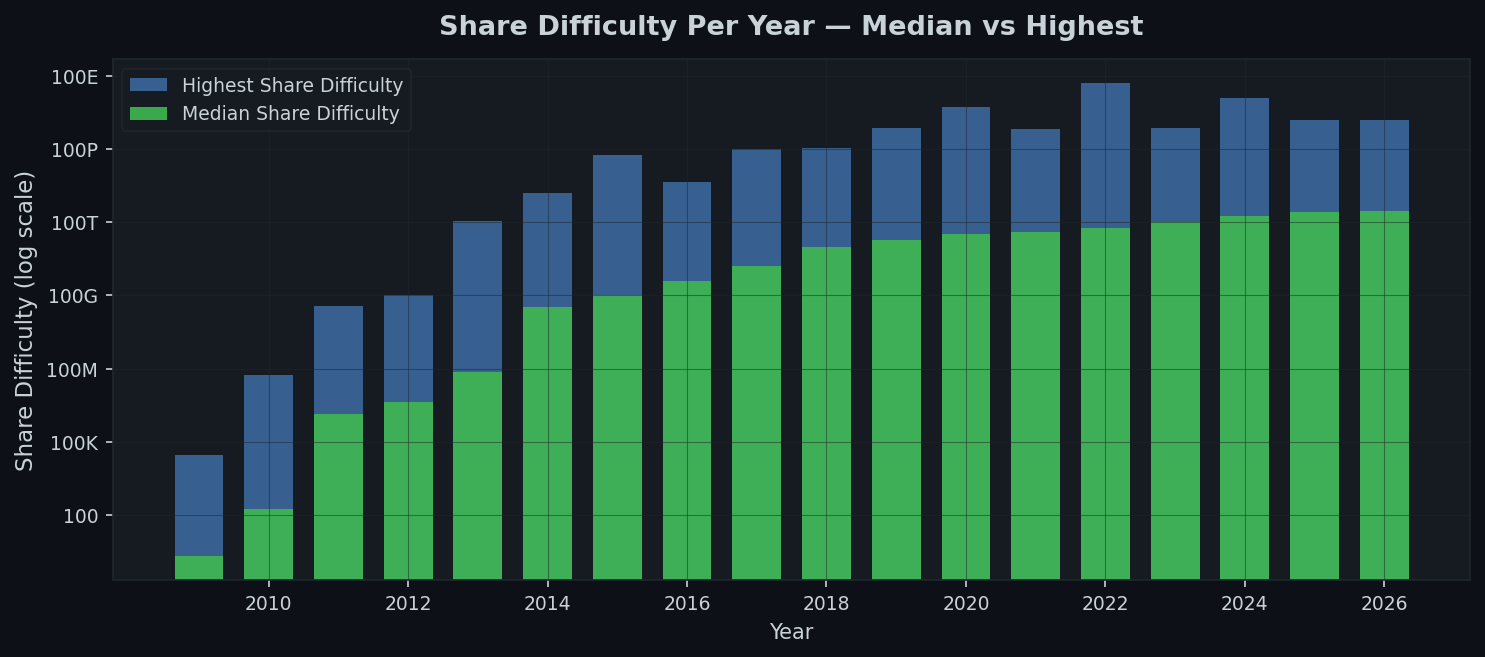
The table below shows the median and highest share difficulty for every year, alongside the average network difficulty for context. We use the median rather than the average for share difficulty because a single extreme outlier (like the 50.54E block in 2022) can dramatically skew a yearly average. The median represents what a typical block looked like that year. For network difficulty, the average is used because difficulty is a fixed value that changes predictably every ~2,016 blocks with no outliers.
Share difficulty follows a heavy-tailed distribution: most blocks barely clear the network difficulty, but rare outliers can overshoot by factors of millions. In 2022, a single block out of 53,188 accounted for over half of the entire year's combined share difficulty. This is why the median is the only meaningful summary. The average is dominated by a handful of extreme events.
| Year | Blocks | Median Share Diff | Highest Share Diff | Block | Avg Net Diff |
|---|---|---|---|---|---|
| 2009 | 32,490 | 2.01 | 28.94 K | 11,686 | 1.00 |
| 2010 | 67,920 | 178.32 | 53.94 M | 61,068 | 1.64 K |
| 2011 | 59,627 | 1.37 M | 35.99 G | 125,552 | 777.38 K |
| 2012 | 54,526 | 4.27 M | 101.00 G | 206,712 | 2.11 M |
| 2013 | 63,433 | 71.43 M | 110.48 T | 266,381 | 169.64 M |
| 2014 | 58,865 | 32.63 G | 1.59 P | 334,261 | 17.55 G |
| 2015 | 54,321 | 109.19 G | 59.30 P | 368,527 | 54.68 G |
| 2016 | 54,851 | 409.35 G | 4.33 P | 403,425 | 203.83 G |
| 2017 | 55,928 | 1.63 T | 98.46 P | 458,091 | 828.92 G |
| 2018 | 54,498 | 9.78 T | 107.58 P | 515,910 | 4.90 T |
| 2019 | 54,232 | 18.03 T | 717.65 P | 585,774 | 8.98 T |
| 2020 | 53,222 | 32.98 T | 5.41 E | 634,842 | 16.54 T |
| 2021 | 52,686 | 40.37 T | 693.24 P | 675,600 | 20.24 T |
| 2022 | 53,188 | 60.52 T | 50.54 E | 756,951 | 30.30 T |
| 2023 | 53,999 | 103.61 T | 739.28 P | 799,182 | 51.85 T |
| 2024 | 53,473 | 175.59 T | 11.96 E | 843,946 | 87.23 T |
| 2025 | 53,082 | 255.70 T | 1.55 E | 912,658 | 128.53 T |
| 2026* | 13,202 | 283.89 T | 1.51 E | 939,000 | 140.23 T |
* 2026 data is partial (through April 3).
The median share difficulty has increased by a factor of roughly 141 trillion from 2009 to 2026, from 2.01 to 283.89T. It tracks closely with network difficulty at approximately 2x, which makes sense: the median block overshoots the difficulty requirement by about 2x, consistent with the mathematical expectation for a uniform random process.
In 2009, the network difficulty was 1.00 for nearly the entire year, the minimum possible value. Satoshi Nakamoto, the inventor of Bitcoin, was essentially the only miner. The median block just barely cleared the bar with a share difficulty of 2.01. Interestingly, the genesis block itself had a share difficulty of 2,536, making it the highest difficulty share of the entire year by a wide margin. By 2026, the median share difficulty had grown to 283.89T. That progression, from a difficulty of 2 to 283 trillion, captures 17 years of Bitcoin's growth in a single number.
The outliers are where it gets fun. The all-time record of 50.54E is nearly 3 times larger than the second highest share difficulty ever recorded (18.69E, also from 2022). That single block in October 2022 produced a hash so rare that it may never be surpassed.
Top 10 All-Time Highest Share Difficulty
| Rank | Block | Date | Share Difficulty | Net Difficulty | Ratio |
|---|---|---|---|---|---|
| 1 | 756,951 | 2022-10-04 | 50.54 E | 31.36 T | 1,611,632x |
| 2 | 742,035 | 2022-06-23 | 18.69 E | 29.57 T | 631,964x |
| 3 | 843,946 | 2024-05-18 | 11.96 E | 83.15 T | 143,807x |
| 4 | 869,693 | 2024-11-10 | 10.45 E | 101.65 T | 102,779x |
| 5 | 845,815 | 2024-05-30 | 6.42 E | 84.38 T | 76,109x |
| 6 | 768,824 | 2022-12-25 | 5.56 E | 35.36 T | 157,114x |
| 7 | 634,842 | 2020-06-15 | 5.41 E | 13.73 T | 394,309x |
| 8 | 858,532 | 2024-08-26 | 1.79 E | 86.87 T | 20,663x |
| 9 | 912,658 | 2025-09-01 | 1.55 E | 129.70 T | 11,962x |
| 10 | 939,000 | 2026-03-02 | 1.51 E | 144.40 T | 10,435x |
Three of the top four blocks were mined in 2022 and 2024. Only one block from before 2022 makes the top 10: block 634,842 from June 2020, which held the record for over two years before block 756,951 shattered it.
The Closest Calls
On the other end of the spectrum are the blocks that just barely made it, hashes that beat the network difficulty by the thinnest possible margin.
Block 915,839 beat the network difficulty of 142.34T by a margin of just 0.000133%. The share difficulty was 142,342,792,896,766, only about 190 million above the threshold. At a difficulty measured in the hundreds of trillions, that's winning a race by a hair's width.
The table below includes all blocks with network difficulty above 1K, which excludes only the very first blocks mined in 2009 when difficulty was at the minimum value of 1.0 and close calls were trivially common.
| Rank | Block | Date | Net Difficulty | Margin |
|---|---|---|---|---|
| 1 | 915,839 | 2025-09-22 | 142.34 T | 0.000133% |
| 2 | 422,250 | 2016-07-25 | 213.49 G | 0.000297% |
| 3 | 728,928 | 2022-03-25 | 27.45 T | 0.000439% |
| 4 | 398,370 | 2016-02-14 | 144.12 G | 0.000448% |
| 5 | 331,816 | 2014-11-27 | 40.30 G | 0.000766% |
| 6 | 316,072 | 2014-08-17 | 19.73 G | 0.000972% |
| 7 | 708,124 | 2021-11-04 | 21.66 T | 0.001030% |
| 8 | 792,247 | 2023-05-31 | 49.55 T | 0.001155% |
| 9 | 652,205 | 2020-10-11 | 19.30 T | 0.001277% |
| 10 | 782,050 | 2023-03-23 | 43.55 T | 0.001421% |
The Most Leading Zeros
Every Bitcoin block hash is a 64-character hexadecimal string. The more leading zeros, the rarer the hash. As network difficulty has increased over the years, the minimum number of leading zeros required has grown, but some blocks go far beyond the minimum.

| Leading Zeros | Example Block | Date | Hash (truncated) |
|---|---|---|---|
| 24 | 756,951 | 2022-10-04 | 0000000000000000000000005d6f0615... |
| 23 | 843,946 | 2024-05-18 | 0000000000000000000000018aed923... |
| 22 | 913,970 | 2025-09-09 | 00000000000000000000001032e11f... |
| 21 | 859,450 | 2024-09-02 | 000000000000000000000100caf61... |
| 20 | 914,270 | 2025-09-11 | 000000000000000000001000aee6... |
Each additional leading zero in hex represents a 16x increase in rarity. The jump from 20 zeros to 24 zeros means 164 = 65,536 times rarer. Block 756,951 set a record that may stand for a very long time.
The table below shows how many blocks in Bitcoin's entire history have achieved each leading zero count. The distribution is not uniform because different zero counts correspond to different difficulty eras.
| Leading Zeros | Blocks | % of All Blocks | Rarity |
|---|---|---|---|
| 8 | 47,419 | 5.03% | 1 in 20 blocks |
| 9 | 20,178 | 2.14% | 1 in 47 blocks |
| 10 | 17,377 | 1.84% | 1 in 54 blocks |
| 11 | 20,715 | 2.20% | 1 in 46 blocks |
| 12 | 21,694 | 2.30% | 1 in 43 blocks |
| 13 | 93,292 | 9.89% | 1 in 10 blocks |
| 14 | 36,098 | 3.83% | 1 in 26 blocks |
| 15 | 23,966 | 2.54% | 1 in 39 blocks |
| 16 | 53,307 | 5.65% | 1 in 18 blocks |
| 17 | 115,939 | 12.29% | 1 in 8 blocks |
| 18 | 119,830 | 12.70% | 1 in 8 blocks |
| 19 | 300,976 | 31.90% | 1 in 3 blocks |
| 20 | 68,268 | 7.23% | 1 in 14 blocks |
| 21 | 4,220 | 0.45% | 1 in 224 blocks |
| 22 | 252 | 0.03% | 1 in 3,744 blocks |
| 23 | 10 | 0.001% | 1 in 94,354 blocks |
| 24 | 2 | 0.0002% | 1 in 471,772 blocks |
By the Numbers
| Statistic | Value |
|---|---|
| Total blocks analyzed | 943,543 |
| Highest share difficulty ever | 50.54E (Block 756,951, Oct 2022) |
| Highest network difficulty ever | 155.97T (Oct 29 – Nov 12, 2025) |
| Median share difficulty (2026) | 283.89 T |
| Median share difficulty (2009) | 2.01 |
| Growth factor (2009 → 2026) | ~141 trillion x |
| Blocks with share diff > 1 E | 14 |
| Blocks with share diff > 10 E | 4 |
| Most leading zeros in a block hash | 24 (only 2 blocks ever) |
| Closest call (net difficulty > 1K) | 0.000133% margin (Block 915,839) |
Data source: This analysis covers all 943,543 Bitcoin blocks from the genesis block (January 3, 2009) through block 943,542 (April 3, 2026). Share difficulty was calculated from each block's hash. Network difficulty was determined from the nBits field in each block header.
Questions, corrections, or feedback? Reach out to @AtlasPool_io on X, or join us on Discord.